Top 10 Blister Packing Machine Manufacturers You Need to Know in 2026
📋 Introduction
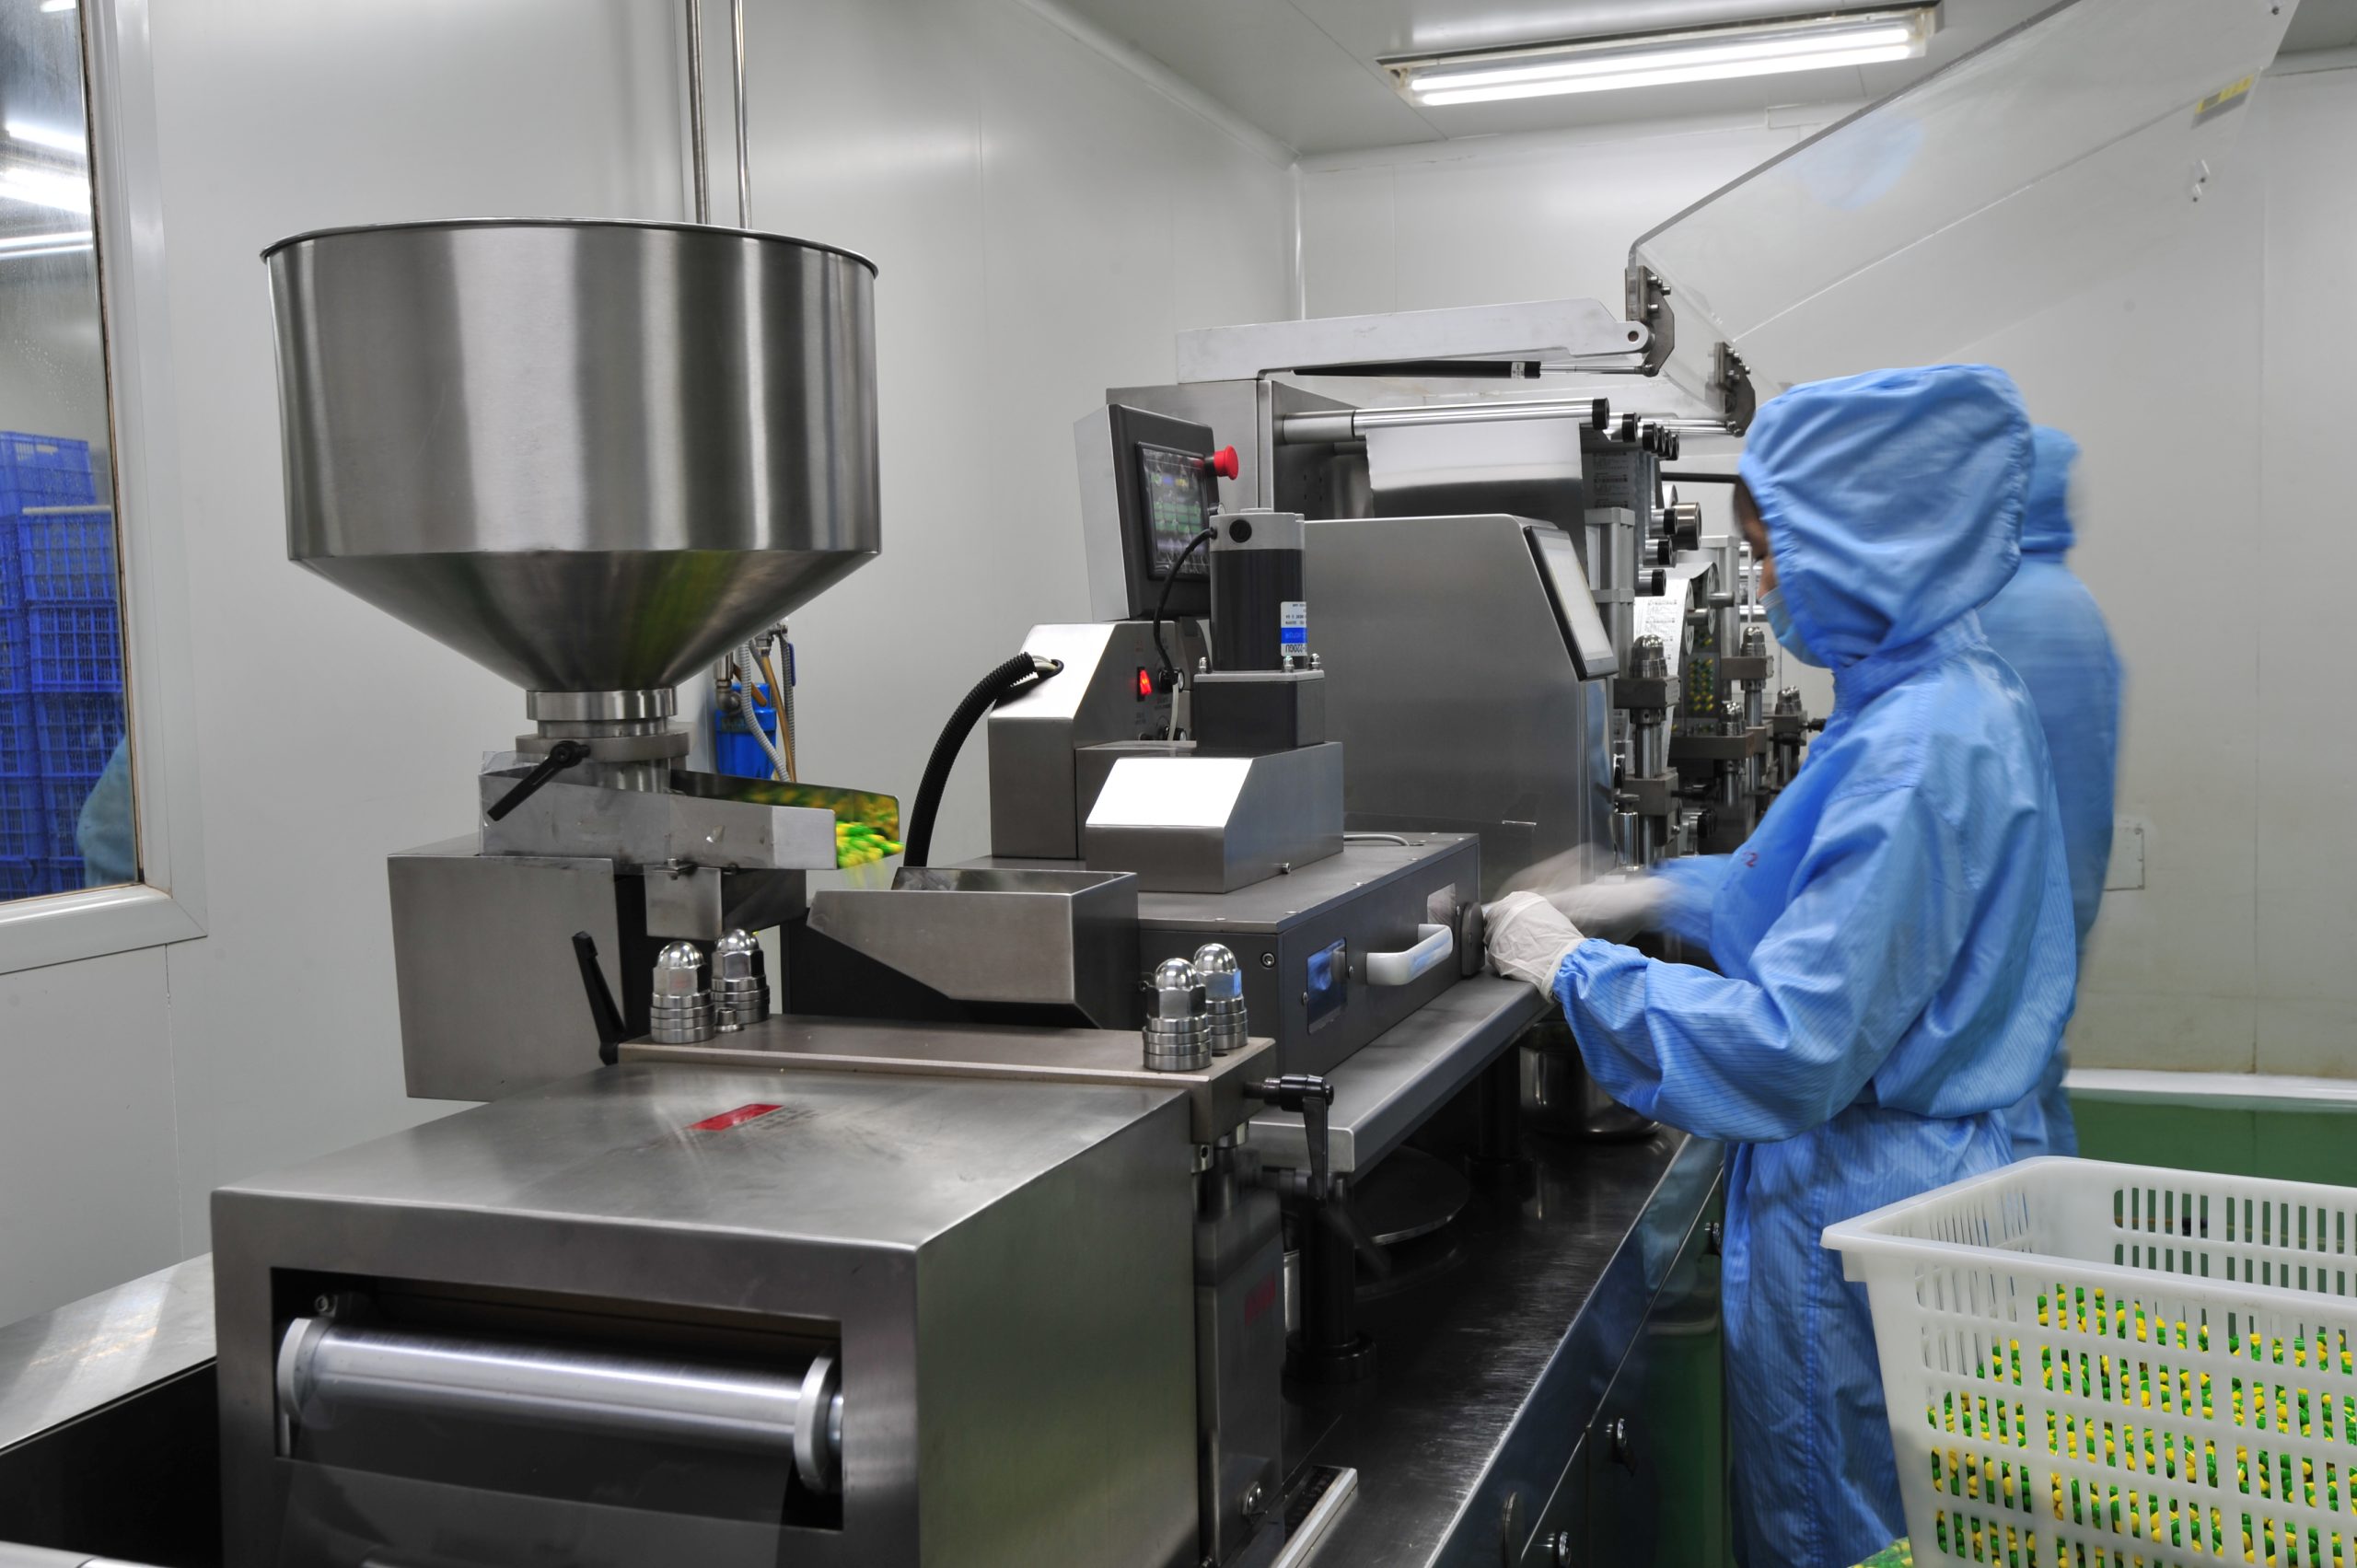
What is a Blister Packing Machine?
A blister packing machine is an automated packaging system that creates protective cavities (blisters) from plastic films, fills them with products, and seals them with backing materials.
🔄 Core Working Process
- 🔥 Heating → Thermoplastic materials softened
- 🔧 Forming → Precise pocket shapes created using molds
- 📦 Filling → Products (tablets, capsules, devices) inserted
- 🔒 Sealing → Aluminum foil or paperboard backing applied
Why Blister Packaging Matters
📊 Market Impact (2025-2027)
| Metric | Value | Timeline |
|---|---|---|
| Pharma Market Share | 35% | 2025 |
| Global Market Size | $45.5B | 2027 (projected) |
| Growth Rate (CAGR) | 6.5% | 2022-2027 |
✅ Key Benefits Across Industries
Pharmaceutical Sector:
- Superior environmental protection (moisture, oxygen, light)
- Enhanced patient compliance through unit-dose packaging
- Tamper-evident safety features
- Extended shelf life
Beyond Pharma:
- Vitamins & supplements
- Confectionery products
- Hardware & electronics
- Medical devices
Why This Guide Matters in 2026
The industry is evolving rapidly with:
- 🤖 Advanced automation technologies
- ♻️ Sustainability mandates
- 📱 Smart packaging integration
- 📈 Stricter regulatory requirements
What You’ll Learn:
- Top 10 global manufacturer profiles
- Practical buying decision framework
- Future technology trends
- Expert selection guidance
🏆 Top 10 Blister Packing Machine Manufacturers
1. Uhlmann Packaging Group 🇩🇪
Official Website | Founded: 1948 | Location: Laupheim, Germany
📊 Market Position
Market Share: ~11% (Industry Leader)
Years of Excellence: 75+
Global Recognition: Top Innovator
🌟 Core Strengths
| Category | Innovation |
|---|---|
| Technology | BFS (Blister Fill Seal) Line |
| Interface | SmartControl Operating System |
| Compliance | Real-time serialization (FDA/EU) |
| Sustainability | Energy-efficient + recyclable materials |
🏅 Awards & Recognition
- Red Dot Design Award (HMI Excellence)
- Top Innovator in Pharma Packaging (Pharma Manufacturing)
💡 Key Differentiators
- ✨ Most intuitive HMI in the industry
- 🔮 Industry 4.0 integration (AI predictive maintenance)
- 🌍 Digital twin simulation capabilities
- 📊 Real-time product tracking
- 🔒 Global serialization compliance
Best For: Large pharmaceutical companies seeking cutting-edge automation
2. IMA Group 🇮🇹
Official Website | Founded: 1961 | Location: Bologna, Italy
📊 Market Position
Market Share: ~12.8% (Largest Market Share)
Global Reach: 80+ countries
Production Facilities: 3 continents
💡 Flagship Products
C80-A81 Series:
- Ultra-high output blister + cartoner combination
- Ideal for large-scale pharmaceutical production
- Integrated quality control systems
C.O.M.E.T. Technology:
- Continuous Monitoring Equipment Technology
- Real-time data acquisition
- Predictive maintenance capabilities
- Advanced analytics dashboard
🎯 Application Focus
| Segment | Solutions | Advantages |
|---|---|---|
| Generics | High-speed standard packaging | Cost efficiency |
| OTC Medications | Flexible format options | Quick changeover |
| Specialty Drugs | Precision handling systems | Quality assurance |
🏆 Industry Recognition
- WorldStar Packaging Award
- Pharma Innovation of the Year
- Multiple EU technology awards
⚡ Competitive Advantages
- 🔧 Eco-design focus (energy efficiency + recyclability)
- 🏭 Production facilities across Europe, Asia, Americas
- 📊 Highest OEE (Overall Equipment Effectiveness) rates
- 🌍 Localized support in 80+ countries
Best For: High-output pharmaceutical manufacturing operations
3. ACG Worldwide 🇮🇳
Official Website | Founded: 1964 | Location: Mumbai, India
📊 Market Position
Market Share: ~9.2%
Unique Position: World's only integrated end-to-end supplier
Global Coverage: 100+ countries across 6 continents
🎁 Complete Solution Portfolio
One-Stop Provider:
- ✅ Empty hard capsules
- ✅ Barrier packaging films & foils
- ✅ Machinery & equipment
- ✅ Inspection systems
- ✅ Track & trace solutions
⚙️ Flagship Technology: B Max Blister Series
| Feature | Capability | Benefit |
|---|---|---|
| Speed | High-throughput production | Increased output |
| Design | Compact footprint | Space savings |
| Compliance | US FDA + EU GMP certified | Global market access |
| Serialization | Built-in Track & Trace | Regulatory compliance |
🚀 2023 Innovation: Smart Connected Machines Platform
Key Features:
- 📱 Remote diagnostics
- 📊 Real-time performance monitoring
- 🔮 Predictive analytics
- 🌐 IoT connectivity
- 📈 OEE optimization
- 🔧 Preventive maintenance alerts
🌍 Global Impact
- Award: India Pharma Innovation Award
- Target Market: Emerging pharma + CDMOs
- Strength: Affordability without quality compromise
Best For: Manufacturers seeking integrated end-to-end solutions
4. Romaco Group 🇩🇪
Official Website | Location: Karlsruhe, Germany
📊 Market Position
Market Share: ~5.5%
Specialization: 7 specialized brands
Key Brands: Romaco Noack, Siebler
Global Presence: 180+ countries
🚄 Speed Leader: Unity 600 Blister Line
Industry-Leading Features:
| Component | Technology | Performance |
|---|---|---|
| Speed | One of fastest in market | Maximum throughput |
| Robotics | Advanced integration | Automated handling |
| Dosing | Precision capabilities | Consistent accuracy |
| Analytics | Comprehensive data systems | Real-time insights |
| Footprint | Remarkably compact | Space optimization |
♻️ Sustainability Focus
Environmental Advantages:
- 🌱 Low energy consumption
- 🔄 Sophisticated waste reduction
- 📊 Energy efficiency monitoring
- 🏆 Award: German Packaging Award (Sustainable Design)
🌐 Global Service Network
- Coverage: 180+ countries
- Regional Hubs: Europe, Asia, Americas
- Support: Localized service centers
- Response Time: Industry-leading
📈 Performance Excellence
- High OEE (Overall Equipment Effectiveness)
- Trusted by pharmaceutical giants
- Excellent uptime reliability
- Proven track record
Best For: Manufacturers prioritizing high-speed production + sustainability
5. Syntegon Technology 🇩🇪
Official Website | Independent since: 2020 | Location: Waiblingen, Germany
📊 Market Position
Market Share: ~10.5%
Heritage: Formerly Bosch Packaging Technology
Focus: Automation + Sustainability
🔬 Innovative Product Line
TPR 500 Tablet Press:
- ✅ Seamless blister line integration
- ✅ Minimized processing time
- ✅ Reduced manual intervention
- ✅ Optimized workflow
Versynta microBatch System:
- ✅ Small-scale production specialist
- ✅ High-precision pharmaceutical products
- ✅ Clinical trial applications
- ✅ Flexible batch sizes
🌿 Sustainability Leadership
Sustainable Blister Pack (SBP) Initiative:
| Feature | Benefit | Impact |
|---|---|---|
| Materials | Recyclable thermoformable films | Environmental protection |
| Plastic Reduction | Significantly reduced consumption | Carbon footprint reduction |
| Recognition | German Sustainability Award Design | Industry leadership |
| Goal | Industry-wide eco-transformation | Market influence |
🌍 Global Presence
- Service Centers: North America, Europe, Asia-Pacific
- Support: Comprehensive technical assistance
- Commitment: Future-ready solutions
- Investment: R&D in green technologies
🎯 Why Choose Syntegon
- 🌱 #1 for sustainability priorities
- 🔧 Advanced automation technologies
- 📦 Product tracking excellence
- 🏆 Award-winning innovations
- 🌍 Global support network
Best For: Companies with strong sustainability commitments
6. Marchesini Group 🇮🇹
Official Website | Founded: 1974 | Location: Pianoro, Italy
📊 Market Position
Market Share: ~7.3%
Industries: Pharmaceutical + Cosmetic
Specialty: Modular & scalable systems
Global Network: 116+ countries
🏗️ Signature Design: MB Series
Balcony-Structured Blister Lines:
Operational Advantages:
| Feature | Benefit | Impact |
|---|---|---|
| Visibility | Maximum process monitoring | Quality control |
| Cleanliness | GMP-compliant design | Regulatory compliance |
| Access | Easy operator intervention | Maintenance efficiency |
| Robotics | Ready-to-integrate systems | Automation ready |
| Speed | High-speed production | Increased throughput |
💻 Digital Innovation Hub
AI & AR Technologies:
- 🤖 Smart maintenance systems → Predictive diagnostics
- 🎓 AR-guided operator training → Faster onboarding
- ⏱️ Reduced downtime → Higher productivity
- 📈 Enhanced operational efficiency → Cost savings
- 🔧 Remote troubleshooting → Quick resolution
🏆 Recent Recognition
- 2022: Best Packaging Innovation Award (Italy)
- Multiple technology excellence awards
- Industry leadership recognition
🌐 Global Capabilities
- Coverage: 116+ countries
- Service: Localized support & customization
- Clients: Multinational pharmaceutical corporations
- Partnerships: Strategic industry collaborations
Best For: Manufacturers seeking modular, scalable solutions with AR support
7. CAM Packaging 🇮🇹
Official Website | Founded: 1940s | Location: Bologna, Italy
📊 Market Position
Market Share: ~3.8%
Heritage: 80+ years experience
Focus: Pharmaceutical + Cosmetic
Strength: Custom solutions
🔧 Product Highlight: nMX Series
Integrated Modular System:
| Integration | Capability | Target Market |
|---|---|---|
| Blistering | Primary packaging | All pharma |
| Cartoning | Secondary packaging | Complete lines |
| Serialization | Track & trace ready | Compliance-focused |
| Scale | Small to medium manufacturers | Growing businesses |
| Flexibility | Modular expansion | Future-ready |
⚙️ Engineering Excellence
CNC-Machined Precision Tooling:
- ⚡ Dramatically reduced setup times
- 🎯 Enhanced product integrity
- 📊 Consistent high-volume performance
- 🔄 Quick format changeovers
- 💎 Superior manufacturing precision
🏅 Innovation Recognition
- European Innovation Grant (Energy-Efficient Design)
- Industry excellence awards
- Engineering achievement recognition
💡 Why Choose CAM
- 🎨 Tailor-made solutions for unique requirements
- 🔬 Decades of engineering expertise and craftsmanship
- 💼 Personalized customer approach and dedicated support
- 🌱 Energy efficiency focus and cost optimization
- 🔧 Precision engineering heritage
Best For: Manufacturers with unique packaging requirements needing custom solutions
8. SED Pharma 🇺🇸
Official Website | Location: Tampa, Florida, USA
📊 Market Position
Market Share: ~2.9%
Regional Focus: Americas (North & Latin)
Specialty: Blister + Strip + Thermoforming
Market: Contract manufacturers + mid-sized pharma
📦 Popular Product: SEDBLM Series
Key Advantages:
| Feature | Benefit | Application |
|---|---|---|
| Design | Compact footprint | Space-constrained facilities |
| Operation | User-friendly interface | Easy training |
| Changeover | Quick tool switching | Multi-product flexibility |
| Efficiency | High production rates | Cost-effective operations |
🖨️ Unique Feature: Flexo-Printing Integration
On-Pack Customization Capabilities:
- ✅ Variable data printing
- ✅ No separate processing needed
- ✅ Multi-SKU management
- ✅ Market-specific packaging
- ✅ Batch/lot coding
- ✅ Expiry date printing
🏭 Compliance & Support
GMP-Compliant Design with End-to-End Solutions:
- 📦 Deblistering equipment
- 📦 Cartoning systems
- 🔍 Vision inspection
- 📚 Strong post-installation training
- 📞 Responsive technical support
- 🔧 Comprehensive documentation
🌎 Regional Advantage
- 🇺🇸 Strong US market presence
- 📞 Responsive customer support
- 🔧 Local technical expertise
- 📋 FDA regulatory compliance focus
- 🤝 Americas-focused partnerships
Best For: Contract manufacturers and mid-sized pharma companies in the Americas
9. PharmaWorks 🇺🇸
Official Website | Location: Odessa, Florida, USA | Part of: ProMach Pharma Solutions
📊 Market Position
Market Share: ~2.5%
Niche: Clinical trials + R&D + Small-batch
Specialty: Custom blister solutions
Focus: Biotech + CDMOs
🔬 Specialized Solutions: TF1e & TF2 Blister Machines
Compact Precision Systems:
| Application | Technology | Scale |
|---|---|---|
| Thermoforming | Servo-driven precision | Clinical to small commercial |
| Cold-forming | Alu-Alu capabilities | High-barrier products |
| Integration | Vision inspection ready | Quality assurance |
| Serialization | Built-in capabilities | Compliance ready |
🛠️ Tooling Innovation Leadership
Retrofit & Rebuild Services:
- 🔄 Legacy equipment upgrades → Extended asset life
- 💰 Extended investment life → Cost savings
- 📈 Modern standards compliance → Regulatory compliance
- ⚙️ Performance improvements → Enhanced output
- 🔧 Custom tooling solutions → Unique applications
🎯 Target Markets
Primary Clients:
- 🔬 Biotech companies
- 🏭 CDMOs (Contract Development & Manufacturing)
- 🧪 Clinical research organizations
- 💊 Specialty pharmaceutical firms
- 🌟 Orphan drug manufacturers
🏆 Industry Recognition
- Multiple awards at US industry expos
- Engineering excellence recognition
- Innovation leadership awards
- Customer satisfaction ratings
💡 Why Choose PharmaWorks
- 🎨 High customization capability
- 🔬 Clinical-scale expertise
- 📞 Exceptional technical support
- 🇺🇸 Strong North American presence
- 🔧 Tooling innovation leadership
Best For: Clinical trials, R&D, and small-batch pharmaceutical manufacturing
10. Jornen Machinery 🇨🇳
Official Website: Jornen | Location: China
📊 Market Position
Category: Emerging Asian Manufacturer
Strength: Cost-effective + High-quality
Target: Domestic + International markets
Growth: Rapidly expanding global presence
⚙️ Machine Design Flexibility
Dual Design Options:
| Type | Application | Materials Supported |
|---|---|---|
| Rotary-type | High-speed production | PVC, PVDC, Alu-Alu |
| Platen-type | Precision forming | Multiple formats |
🎯 Technical Features
Modern Technology Integration:
- ⚡ Servo-driven systems → High precision operations
- 📱 HMI touchscreen controls → User-friendly interface
- ✅ Auto-rejection features → Built-in QA
- 🔍 Quality assurance systems → Consistent output
- 🔧 Modular design → Easy maintenance
📜 International Compliance
Certifications & Standards:
- ✅ CE Standards (Europe)
- ✅ cGMP Compliance (Global pharma)
- 🌍 Export-ready for regulated markets
- 📋 ISO certifications
- 🔒 Safety standards compliance
💰 Competitive Advantage
Value Proposition:
- 💵 Attractive price points
- 🔧 Customizable solutions
- 🌐 Advanced technology access
- 🏭 SME-focused (Small & Medium Enterprises)
- 📈 Scalable options
🌏 Market Impact
- Rising competitiveness of Asian manufacturers
- Growing international recognition
- Expanding technical capabilities
- Emerging market accessibility
- Increasing quality standards
✨ Why Choose Jornen
- 💵 Best cost-to-performance ratio
- 🌍 International compliance ready
- 🔧 Customization flexibility
- 📈 Perfect for growing businesses
- 🤝 Responsive support team
Best For: Cost-conscious buyers and growing pharmaceutical businesses in emerging markets
📊 Quick Comparison: Top 10 Manufacturers
Market Overview Table
| Manufacturer | Country | Market Share | Best For |
|---|---|---|---|
| Uhlmann | 🇩🇪 Germany | ~11% | Large pharma + Industry 4.0 |
| IMA Group | 🇮🇹 Italy | ~12.8% | High output + predictive maintenance |
| ACG Worldwide | 🇮🇳 India | ~9.2% | Integrated end-to-end solutions |
| Romaco | 🇩🇪 Germany | ~5.5% | High-speed + sustainability |
| Syntegon | 🇩🇪 Germany | ~10.5% | Sustainability focus + automation |
Specialized Manufacturers
| Manufacturer | Country | Market Share | Best For |
|---|---|---|---|
| Marchesini | 🇮🇹 Italy | ~7.3% | Modular design + AR technology |
| CAM | 🇮🇹 Italy | ~3.8% | Custom solutions + precision |
| SED Pharma | 🇺🇸 USA | ~2.9% | Contract manufacturing + Americas |
| PharmaWorks | 🇺🇸 USA | ~2.5% | Clinical trials + small-batch |
| Jornen | 🇨🇳 China | Emerging | Cost-conscious + growing businesses |
Key Strengths Summary
| Manufacturer | Primary Strength | Innovation Focus |
|---|---|---|
| Uhlmann | Industry 4.0 + AI integration | SmartControl HMI |
| IMA Group | Predictive maintenance | C.O.M.E.T. Technology |
| ACG | End-to-end integration | Smart Connected Machines |
| Romaco | Speed + efficiency | Unity 600 Line |
| Syntegon | Sustainability leadership | SBP Initiative |
| Marchesini | Digital innovation | AI & AR Hub |
| CAM | Precision engineering | CNC tooling |
| SED Pharma | Flexo-printing | On-pack customization |
| PharmaWorks | Tooling innovation | Retrofit services |
| Jornen | Cost-effectiveness | Value engineering |
💡 Market Insight
Combined Market Influence: These 10 manufacturers represent >70% of the global pharmaceutical blister packaging machine market.
🛒 Complete Buying Guide: How to Choose the Right Machine
🎯 10-Step Decision Framework
Step 1: Production Capacity Requirements 📈
Machine Speed Categories
| Category | Speed (blisters/min) | Best For | Investment Level |
|---|---|---|---|
| Small-scale | 20-40 | R&D, clinical trials | $ |
| Mid-range | 40-150 | Contract manufacturers | $$ |
| High-speed | 150-300+ | Large pharma | $$$ |
📋 Capacity Planning Checklist
Current State Assessment:
- Daily production volume requirements
- Weekly/monthly output targets
- Seasonal demand variations
- Current shift operations
Future Planning:
- 3-year growth projections
- 5-year expansion plans
- Product portfolio diversification
- Market expansion strategy
💡 Capacity Planning Formula
Required Machine Capacity =
(Peak Daily Demand × 1.2) / (Available Production Hours × OEE)
Pro Tip: Choose a machine with 20-30% capacity buffer beyond immediate needs for growth accommodation.
Step 2: Product Specifications & Compatibility 📦
Product Dimension Analysis
Critical Measurements:
- Tablet/capsule diameter (mm)
- Product height/thickness
- Irregular shapes handling
- Weight variations
- Fragility considerations
Material Compatibility Matrix
| Material | Barrier Properties | Sustainability | Best For |
|---|---|---|---|
| PVC | Standard | ⭐ | General pharma |
| PVDC | Enhanced | ⭐⭐ | Moisture-sensitive |
| Alu-Alu | Maximum | ⭐ | High-value drugs |
| PET | Good | ⭐⭐⭐⭐ | Eco-friendly |
| Paper-based | Moderate | ⭐⭐⭐⭐⭐ | Sustainability leaders |
Package Format Options
Standard Configurations:
- ✅ Single-dose packaging
- ✅ Multi-cavity (2-10 units)
- ✅ Child-resistant designs
- ✅ Senior-friendly formats
- ✅ Calendar packs
- ✅ Peel-push designs
Special Handling Requirements
Product Sensitivity Considerations:
- 🌡️ Temperature sensitivity
- 💧 Moisture sensitivity
- ☀️ Light sensitivity
- 🧲 Electrostatic concerns
- 🔬 Contamination risks
🎯 Action Item: Request sample runs with your actual products to verify compatibility before purchase.
Step 3: Automation Level Selection 🤖
Three-Tier Automation Model
| Level | Labor Intensity | Investment | Capacity | Flexibility |
|---|---|---|---|---|
| Manual | High | $ | Low | High |
| Semi-Automatic | Medium | $$ | Medium | Medium |
| Fully Automatic | Low | $$$ | High | Low-Medium |
Detailed Automation Breakdown
Manual Systems:
- 👤 Operator-dependent feeding
- 🔧 Manual quality checks
- 📊 Limited data collection
- Best For: Clinical trials, R&D, <5,000 units/day
Semi-Automatic Systems:
- ⚙️ Automated forming and sealing
- 👤 Manual product feeding
- 🔍 Semi-automated inspection
- Best For: Mid-volume, 5,000-50,000 units/day
Fully Automatic Systems:
- 🤖 Complete automation
- 🔍 Integrated vision systems
- 📊 Real-time data analytics
- Best For: High-volume, >50,000 units/day
💰 ROI Calculation Factors
Cost Components to Balance:
- Initial Investment
- Machine purchase price
- Installation costs
- Validation expenses
- Operating Costs
- Labor (operators + technicians)
- Energy consumption
- Maintenance expenses
- Quality Impact
- Error rates
- Rejection rates
- Rework costs
🔍 Decision Matrix
| Daily Output | Recommended Level | Payback Period |
|---|---|---|
| <10,000 units | Semi-automatic | 2-3 years |
| 10,000-50,000 | Semi/Full automatic | 1-2 years |
| >50,000 units | Fully automatic | <1 year |
💡 Strategic Tip: Higher automation = lower variable costs, higher fixed costs. Calculate break-even point carefully.
Step 4: Regulatory Compliance & Documentation 📜
Global Regulatory Requirements
Regional Compliance Matrix:
| Region | Key Regulations | Documentation Needed |
|---|---|---|
| USA | FDA 21 CFR Part 11 | Electronic records validation |
| Europe | EU GMP Annex 11 | Computerized systems compliance |
| Global | ICH Q7/Q9 | Quality management systems |
| China | NMPA requirements | Registration documentation |
Essential Compliance Features
Machine-Level Requirements:
- ✅ Audit trail capabilities
- ✅ User access controls (multi-level)
- ✅ Electronic signatures support
- ✅ Data integrity assurance
- ✅ Backup and recovery systems
Serialization & Traceability
Track-and-Trace Capabilities:
| Feature | Function | Compliance Level |
|---|---|---|
| Unit-level serialization | Individual product coding | Mandatory (USA/EU) |
| Aggregation | Hierarchy linking | Mandatory (USA/EU) |
| Vision verification | Code readability check | Best practice |
| Database integration | Real-time reporting | Mandatory |
📋 Documentation Package Checklist
Required from Manufacturer:
- IQ Protocols (Installation Qualification)
- OQ Protocols (Operational Qualification)
- PQ Protocols (Performance Qualification)
- Material certificates (food/pharma grade)
- Safety documentation (CE, UL, etc.)
- Software validation documentation
- User manuals (comprehensive)
- Training materials (SOPs, videos)
🌍 International Standards
Certification Requirements:
- 🇪🇺 CE Marking (Europe)
- 🇺🇸 FDA Registration (USA)
- 🌐 ISO 9001 (Quality Management)
- 🏭 GMP Compliance (Pharma)
- 🔒 ISO 13485 (Medical Devices)
⚠️ Critical: Verify manufacturer provides comprehensive validation support for your target markets before signing contracts.
Step 5: Flexibility & Changeover Speed ⚡
Why Flexibility is Critical in 2026
Market Drivers:
- 💊 Personalized medicine growth
- 🔬 Smaller batch requirements
- 📦 SKU proliferation
- 🌍 Regional market variations
- ⚡ Quick market response needs
Changeover Time Standards
| Rating | Time Required | Technology | Productivity Impact |
|---|---|---|---|
| Excellent | <15 minutes | Tool-free | Minimal loss |
| Good | 15-30 minutes | Quick-change | Moderate loss |
| Acceptable | 30-60 minutes | Semi-automated | Significant loss |
| Poor | >60 minutes | Manual | Major loss |
🔧 Flexibility Features Evaluation
Tool-Free Changeover Systems:
- ⚡ No specialist technicians required
- 🔧 No special tools needed
- 👤 Single operator capable
- ⏱️ Time Savings: 50-70%
Quick-Change Format Parts:
- 🎯 Precision-engineered components
- 🔄 Snap-in/snap-out design
- 📏 Pre-calibrated settings
- ⏱️ Time Savings: 40-60%
Multi-Format Capability Matrix
| Product Type | Size Range | Package Types | Changeover Time |
|---|---|---|---|
| Tablets | 3mm – 25mm | Single/multi-cavity | 10-20 min |
| Capsules | Size 5 – 0000 | Standard/elongated | 15-25 min |
| Irregular shapes | Custom | Custom blisters | 20-30 min |
📊 OEE Impact Analysis
Overall Equipment Effectiveness Formula:
OEE = Availability × Performance × Quality

Availability = Operating Time / Planned Production Time
Changeover Impact Example:
- Poor System (60 min changeover): 2 changes/day = 2 hours downtime
- Excellent System (15 min changeover): 8 changes/day = 2 hours downtime
- Flexibility Gain: 4× more product variety with same downtime
🎯 Evaluation Checklist
During Machine Demonstration:
- Time actual changeover (from last good unit to first good unit)
- Count operators required
- Note tools needed
- Assess complexity level
- Verify quality after changeover
- Measure waste/startup scrap
💡 Pro Tip: Request video documentation of changeover procedures. What looks simple in demonstrations may be complex in daily operations.
Step 6: Quality Control & Inspection Systems 🔍
Integrated Quality Architecture
Quality Control Layers:
| Layer | Technology | Coverage | Detection Rate |
|---|---|---|---|
| Forming | Cavity depth sensors | 100% | >99.5% |
| Filling | Vision verification | 100% | >99.9% |
| Sealing | Temperature/pressure monitoring | 100% | >99.8% |
| Final | Vision + leak detection | 100% | >99.95% |
🔬 Vision Inspection Systems
Camera-Based Quality Control:
Inspection Capabilities:
- ✅ Product presence verification
- ✅ Orientation checking
- ✅ Color consistency
- ✅ Embossing verification
- ✅ Seal integrity assessment
- ✅ Foreign object detection
Technology Types:
| System | Application | Accuracy | Cost |
|---|---|---|---|
| 2D Vision | Standard inspection | 99.5% | $ |
| 3D Vision | Depth/height check | 99.8% | $$ |
| Hyperspectral | Material verification | 99.9% | $$$ |
🧪 Leak Detection Methods
Integrity Testing Technologies:
| Method | Principle | Speed | Reliability |
|---|---|---|---|
| Vacuum Decay | Pressure drop measurement | Fast | 99.9% |
| Dye Ingress | Visual dye penetration | Slow | 99.5% |
| Ultrasonic | Sound wave analysis | Fast | 99.7% |
| Laser | Micro-hole detection | Very fast | 99.95% |
📊 Inspection Coverage Options
100% Inline Inspection:
Advantages:
- ✅ Zero defect potential
- ✅ Complete traceability
- ✅ Regulatory compliance
- ✅ Brand protection
Best For:
- High-value products (>$50/unit)
- Critical medications
- Export to regulated markets
- Zero-tolerance quality policies
Statistical Sampling:
Advantages:
- ✅ Lower equipment cost
- ✅ Faster line speed
- ✅ Established in stable processes
- ✅ Cost-effective for generics
Best For:
- Mature products with stable processes
- High-volume generics
- Non-critical applications
- Cost-sensitive markets
🔄 Auto-Rejection Systems
Defect Removal Technologies:
| System | Mechanism | Speed | Accuracy |
|---|---|---|---|
| Pneumatic | Air blast ejection | High | 99.5% |
| Mechanical | Pusher arms | Medium | 99.7% |
| Robotic | Pick-and-place | High | 99.9% |
📈 Quality Data Management
Real-Time Reporting Capabilities:
- 📊 Defect rate tracking
- 📈 Trend analysis
- 🔔 Alert notifications
- 📋 Batch documentation
- 🔍 Root cause analysis
- 📦 Traceability records
💡 Recommendation: Prioritize machines with integrated vision systems and comprehensive validation protocols for pharmaceutical applications.
Step 7: Total Cost of Ownership (TCO) 💰
5-Year TCO Components
Cost Breakdown Analysis:
| Category | % of TCO | Annual Average | 5-Year Total |
|---|---|---|---|
| Capital Investment | 30-40% | One-time | $200K-$500K |
| Energy Costs | 15-20% | $15K-$30K | $75K-$150K |
| Maintenance & Parts | 20-25% | $20K-$40K | $100K-$200K |
| Labor & Training | 10-15% | $12K-$25K | $60K-$125K |
| Consumables | 10-15% | $10K-$20K | $50K-$100K |
🔢 Comprehensive TCO Formula
Total Cost of Ownership (5 years) =

Initial Investment
+ Installation & Validation
+ (Annual Energy × 5)
+ (Annual Maintenance × 5)
+ (Labor Costs × 5)
+ (Consumables × 5)
+ Training & Certification
- Residual Value
⚡ Energy Consumption Analysis
Power Requirements Comparison:
| Machine Type | Power Draw | Daily Cost | Annual Cost |
|---|---|---|---|
| Manual | 2-5 kW | $5-$12 | $1,800-$4,400 |
| Semi-Auto | 8-15 kW | $19-$36 | $7,000-$13,000 |
| Fully Auto | 20-40 kW | $48-$96 | $17,500-$35,000 |
Additional Utilities:
- 💨 Compressed air: $3,000-$8,000/year
- 🌡️ HVAC impact: $2,000-$5,000/year
- 💧 Cooling water (if needed): $500-$2,000/year
🔧 Maintenance Cost Breakdown
Annual Maintenance Components:
| Item | Frequency | Annual Cost |
|---|---|---|
| Preventive maintenance | Monthly | $5,000-$12,000 |
| Spare parts inventory | As needed | $8,000-$18,000 |
| Tooling replacement | Quarterly | $4,000-$10,000 |
| Software updates | Annual | $1,000-$3,000 |
| Calibration services | Semi-annual | $2,000-$5,000 |
📦 Consumables Costs
Ongoing Material Expenses:
| Consumable | Usage Rate | Annual Cost |
|---|---|---|
| Forming film | Per blister | $15,000-$40,000 |
| Sealing foil | Per blister | $10,000-$25,000 |
| Printing supplies | Variable | $2,000-$8,000 |
| Cleaning materials | Regular | $1,000-$3,000 |
💡 Hidden Costs to Consider
Often-Overlooked Expenses:
- 🏭 Facility modifications → $10K-$50K one-time
- 🔌 Electrical upgrades → $5K-$20K one-time
- 🏗️ Structural reinforcement → $2K-$15K one-time
- 📚 Operator certification → $1K-$3K per operator
- ⏰ Startup losses → $5K-$15K one-time
- 🔧 Special tooling → $3K-$10K per product
📊 TCO Comparison Example
Scenario: Mid-Size Pharma, 5-Year Horizon
| Cost Category | Machine A | Machine B | Difference |
|---|---|---|---|
| Purchase Price | $300,000 | $250,000 | -$50,000 |
| Energy (5yr) | $120,000 | $150,000 | +$30,000 |
| Maintenance (5yr) | $80,000 | $120,000 | +$40,000 |
| Downtime Losses | $30,000 | $60,000 | +$30,000 |
| Total TCO | $530,000 | $580,000 | +$50,000 |
Result: More expensive Machine A has $50K lower TCO over 5 years.
🎯 Action Items
Request from Manufacturers:
- Detailed 5-year TCO analysis
- Energy consumption specifications
- Maintenance cost estimates
- Spare parts pricing list
- Consumables cost projections
- Typical downtime statistics
- Customer reference data
💡 Pro Tip: The lowest purchase price rarely equals the lowest total cost. Focus on 5-year TCO for true value assessment.
Step 8: Technical Support & Service Network 🛠️
Service Level Evaluation Framework
Critical Support Dimensions:
| Criteria | World-Class | Acceptable | Poor |
|---|---|---|---|
| Response Time | <4 hours | 4-24 hours | >24 hours |
| Local Presence | On-site technicians | Regional center | Remote only |
| Spare Parts | 24-48h delivery | 1 week | >2 weeks |
| Uptime Guarantee | 98%+ | 95-97% | <95% |
🌐 Service Network Assessment
Geographic Coverage Checklist:
- Local service center within 200 miles
- Regional warehouse for spare parts
- Country-specific support hotline
- Time zone aligned support hours
- Language support in local language
📞 Support Tier Structure
Level 1: Basic Support (Included)
- ☎️ Phone and email support
- 📧 Ticketing system
- 📚 Online documentation
- 🎥 Training videos
- Response: 4-8 hours
Level 2: Standard Support (Recommended)
- 🖥️ Remote diagnostics
- 📱 Real-time monitoring
- 🔍 Predictive alerts
- 📊 Performance reports
- Response: 2-4 hours
Level 3: Premium Support (High-Value)
- 🚗 On-site technician visits
- 🔧 Quarterly preventive maintenance
- 📈 Optimization consultations
- 🎓 Annual training refreshers
- Response: <2 hours
Level 4: Dedicated Support (Enterprise)
- 👤 Dedicated support engineer
- 📞 24/7 hotline access
- 🔄 Guaranteed uptime SLA
- 🚀 Priority parts shipping
- Response: <1 hour
🔧 Maintenance Program Options
Preventive Maintenance Packages:
| Package | Frequency | Services Included | Annual Cost |
|---|---|---|---|
| Basic | Annual | Inspection + cleaning | $3K-$6K |
| Standard | Quarterly | PM + calibration | $8K-$15K |
| Premium | Monthly | Full service + parts | $18K-$30K |
📦 Spare Parts Management
Parts Availability Strategies:
Consignment Inventory:
- ✅ Parts stored on-site
- ✅ Pay only when used
- ✅ Immediate availability
- ✅ Reduced downtime risk
Just-in-Time Delivery:
- ✅ Lower storage costs
- ✅ 24-48 hour delivery
- ✅ Manufacturer manages stock
- ✅ Suitable for stable operations
Critical Spares Kit:
- ✅ Pre-selected essential parts
- ✅ One-time purchase
- ✅ Emergency backup
- ✅ 1-2 year buffer
🎓 Training & Knowledge Transfer
Operator Training Programs:
| Program | Duration | Participants | Content |
|---|---|---|---|
| Basic Operation | 2-3 days | Operators | Daily operations |
| Maintenance Level 1 | 3-5 days | Technicians | Routine maintenance |
| Maintenance Level 2 | 5-7 days | Engineers | Advanced troubleshooting |
| Master Certification | 10-15 days | Specialists | Expert-level skills |
🔄 Software Updates & Upgrades
Technology Refresh Policy:
- 🆕 Software updates → Free (bug fixes, security)
- 📈 Feature upgrades → Paid (new capabilities)
- 🔧 Firmware updates → Free (performance improvements)
- 🎯 Technology roadmap → 5-year visibility
📊 Service Level Agreement (SLA) Metrics
Key Performance Indicators:
| Metric | Target | Measurement |
|---|---|---|
| First Response Time | <4 hours | Call to acknowledgment |
| Mean Time to Repair | <24 hours | Problem to resolution |
| Parts Availability | >95% | In-stock rate |
| Uptime Guarantee | >98% | Annual availability |
🌍 Global vs. Local Support
Decision Factors:
Global Manufacturer Benefits:
- 🌐 Worldwide expertise sharing
- 🔬 Advanced technical resources
- 📊 Best practice access
- 🔄 Technology updates
Local Distributor Benefits:
- 🚗 Faster on-site response
- 💬 Language/culture alignment
- 🤝 Relationship focus
- 💰 Lower service costs
✅ Pre-Purchase Verification
Reference Check Questions:
- “What’s the average response time to service calls?”
- “How often do you experience parts shortages?”
- “What’s the typical MTTR (Mean Time to Repair)?”
- “How satisfied are you with training quality?”
- “Would you buy from them again?”
💡 Strategic Tip: Choose manufacturers with established service infrastructure in your region. Equipment performance means nothing without responsive support.
Step 9: Sustainability Features ♻️
Why Sustainability Matters in 2026
Business Drivers:
- 🌍 Corporate ESG commitments
- 📜 Regulatory requirements (EU PPWR)
- 💚 Consumer demand for eco-packaging
- 💰 Energy cost reduction
- 🏆 Brand reputation enhancement
🌱 Green Machine Features
Environmental Performance Metrics:
| Feature | Environmental Impact | Business Benefit |
|---|---|---|
| Energy efficiency | -30% CO₂ emissions | -25% operating costs |
| Material flexibility | Recyclable packaging | Brand reputation |
| Waste reduction | -40% material waste | Cost savings |
| Modular design | Extended machine life | Lower TCO |
⚡ Energy Efficiency Technologies
Power-Saving Features:
- 🔋 Regenerative drives → Energy recovery
- 💡 LED lighting → 75% power reduction
- 🌡️ Heat recovery systems → HVAC cost savings
- 😴 Sleep mode → Auto power-down
- 📊 Energy monitoring → Real-time tracking
Efficiency Ratings:
| Rating | Energy Consumption | Annual Savings |
|---|---|---|
| Standard | Baseline | $0 |
| Energy Star | -15% vs baseline | $5,000-$8,000 |
| Premium Efficient | -30% vs baseline | $10,000-$15,000 |
📦 Sustainable Material Compatibility
Material Support Matrix:
| Material Type | Recyclability | Machine Compatibility | Market Readiness |
|---|---|---|---|
| Traditional PVC | ⭐ Low | Universal | Mature |
| PET/PP | ⭐⭐⭐ Good | Most machines | Growing |
| Paper-based | ⭐⭐⭐⭐⭐ Excellent | Specialized | Emerging |
| Bio-based films | ⭐⭐⭐⭐ Very good | Limited | Early stage |
🔄 Waste Reduction Systems
Minimizing Production Waste:
Smart Material Management:
- 🎯 Optimized film pull
- 📏 Precision cutting
- ♻️ Scrap recycling integration
- 📊 Real-time waste tracking
Waste Reduction Impact:
| System | Waste Reduction | Annual Savings |
|---|---|---|
| Standard | Baseline (5-7%) | $0 |
| Optimized | 3-4% waste | $8,000-$15,000 |
| Premium | <2% waste | $15,000-$25,000 |
🏭 Machine Longevity & Modularity
Sustainable Design Principles:
Modular Architecture Benefits:
- 🔧 Component upgrades → vs full replacement
- 📈 Technology refresh → Incremental improvements
- 🔄 Repairability → Extended operational life
- ♻️ End-of-life recycling → Material recovery
Expected Lifespan:
| Design Type | Operational Life | Total Packages |
|---|---|---|
| Standard | 10-12 years | 500M-800M |
| Modular | 15-20 years | 1B-1.5B |
| Premium | 20-25 years | 1.5B-2B |
📊 Carbon Footprint Documentation
What to Request from Manufacturers:
- Energy consumption data sheets (kWh/1000 blisters)
- Carbon footprint calculations (kg CO₂e)
- Life cycle assessment (LCA) reports
- ISO 14001 certification (Environmental Management)
- Sustainability report (annual)
- Recyclable content percentage
- End-of-life recycling program
🎯 Sustainability Certifications
Industry Standards:
| Certification | Focus Area | Value |
|---|---|---|
| ISO 14001 | Environmental management | Baseline |
| ISO 50001 | Energy management | Energy efficiency |
| LEED | Green building | Facility integration |
| Carbon Neutral | Net-zero emissions | Premium |
📈 ROI of Green Features
Payback Period Analysis:
Energy-Efficient Model (+$50K premium):
- 💰 Annual energy savings: $15,000
- 💚 Waste reduction savings: $10,000
- 🏆 Brand value increase: Priceless
- Payback period: 2 years
🌍 Regulatory Future-Proofing
Upcoming EU PPWR Requirements (2030):
- ♻️ Recyclability targets: 65% minimum
- 🔄 Recycled content: 25% minimum
- 📊 Reporting obligations: Mandatory tracking
- 💰 Extended producer responsibility: Cost implications
💡 Strategic Recommendation:
Invest in machines that support sustainable materials today to avoid costly upgrades tomorrow. Align equipment capabilities with corporate environmental goals and anticipated regulations.
Future-Proof Checklist:
- Paper-based blister compatibility
- Recyclable film support
- Energy monitoring systems
- Waste tracking capabilities
- Upgrade pathway to bio-based materials
Step 10: Integration Capabilities 🔗
Ecosystem Compatibility
Four Integration Layers:
| Layer | Integration Type | Complexity | Business Value |
|---|---|---|---|
| Equipment | Physical line connection | Medium | Production flow |
| Software | ERP/MES systems | High | Data visibility |
| Data | Industry 4.0/IoT | High | Smart factory |
| Compliance | Serialization systems | Medium | Regulatory |
🏭 Production Line Integration
Upstream Equipment Connectivity:
| Equipment | Connection Type | Data Exchange |
|---|---|---|
| Tablet press | Mechanical + data | Batch synchronization |
| Coating system | Data only | Quality parameters |
| Metal detector | Inline | Rejection coordination |
| Inspection system | Vision network | Quality data |
Downstream Equipment Connectivity:
| Equipment | Connection Type | Data Exchange |
|---|---|---|
| Cartoning machine | Mechanical + data | Speed matching |
| Case packer | Data + control | Production counting |
| Palletizer | Control signals | Batch completion |
| Warehouse system | Network | Inventory updates |
💻 Software Integration Architecture
Enterprise System Connections:
ERP Integration (SAP, Oracle):
- 📊 Production planning data
- 📦 Inventory management
- 💰 Cost accounting
- 📈 Performance metrics
MES Integration (Rockwell, Siemens):
- ⚙️ Recipe management
- 📋 Batch records
- 🔍 Quality data
- 📊 OEE calculations
LIMS Integration:
- 🧪 Quality test results
- ✅ Release decisions
- 📑 Certificate of analysis
- 🔬 Trending analysis
📡 Industry 4.0 Readiness
Smart Factory Capabilities:
| Feature | Technology | Benefit |
|---|---|---|
| IoT Sensors | Real-time monitoring | Predictive maintenance |
| Cloud Connectivity | Remote access | Global visibility |
| Data Analytics | AI/ML algorithms | Performance optimization |
| Digital Twin | Virtual simulation | Risk-free testing |
🔌 Communication Protocols
Standard Industrial Protocols:
| Protocol | Application | Adoption Rate |
|---|---|---|
| OPC UA | Machine-to-machine | 85% (standard) |
| MQTT | IoT messaging | 60% (growing) |
| Ethernet/IP | Real-time control | 70% (established) |
| Modbus TCP | Legacy integration | 90% (universal) |
🔐 Serialization Integration
Track-and-Trace System Connection:
Required Capabilities:
- 🔢 Unique code generation
- 🖨️ Printer integration (inkjet, laser, thermal)
- 📷 Vision verification
- 🗄️ Database connectivity
- 📊 Aggregation management
- 🌐 Level 3/4 system integration
Data Flow:
Level 4 (ERP)
    ↓
Level 3 (MES/Serialization Server)
    ↓
Level 2 (Line Controller)
    ↓
Level 1 (Blister Machine)
📊 Real-Time Data Exchange
Production Data Shared:
| Data Type | Update Frequency | Recipients |
|---|---|---|
| Unit count | Real-time | All systems |
| Quality status | Per inspection | QA + MES |
| Downtime events | Immediate | Maintenance + planning |
| Material usage | Batch-level | ERP + inventory |
| OEE metrics | Every minute | Dashboard |
🎯 Integration Specification Checklist
Technical Requirements to Verify:
Physical Integration:
- Line height compatibility (± 50mm)
- Width/footprint alignment
- Electrical specifications match
- Compressed air availability
- Environmental controls
Data Integration:
- Communication protocol support (OPC UA preferred)
- Network security compliance
- Data format compatibility (JSON, XML)
- API documentation availability
- System response time requirements
Software Integration:
- ERP connector availability
- MES middleware support
- Database compatibility (SQL, Oracle)
- User authentication integration (LDAP, AD)
- Backup and disaster recovery
🔄 Line Synchronization
Speed Matching Requirements:
| Scenario | Synchronization Type | Complexity |
|---|---|---|
| Continuous flow | Real-time speed adjustment | High |
| Buffer zones | Batch-level coordination | Medium |
| Accumulation table | Independent operation | Low |
🌐 Remote Monitoring Capabilities
Digital Connectivity Benefits:
For Production Team:
- 📱 Mobile app notifications
- 📊 Real-time dashboard access
- ⚠️ Immediate alert notifications
- 📈 Performance trending
For Management:
- 💼 Multi-site visibility
- 📊 KPI tracking
- 💰 Cost analysis
- 🎯 Decision support
For Service Provider:
- 🔧 Remote diagnostics
- 📊 Predictive maintenance
- 🎓 Training support
- 📈 Performance optimization
🛡️ Cybersecurity Considerations
Network Security Requirements:
- 🔒 Firewall protection → Network segmentation
- 🔐 Encrypted communication → SSL/TLS protocols
- 👤 Access control → Role-based permissions
- 📝 Audit logging → Complete traceability
- 🔄 Regular updates → Security patches
📋 Pre-Purchase Integration Verification
Request from Manufacturer:
- Integration specification document
- Communication protocol details
- API documentation (if applicable)
- Reference installations with similar setup
- Integration support included in price
- Commissioning timeline with integration
- Training on integration features
💡 Integration Success Factors
Critical Success Elements:
- Early Planning → Involve IT/automation team from RFQ stage
- Standards Compliance → Use industry-standard protocols
- Documentation → Comprehensive technical specs
- Testing → Factory acceptance test (FAT) with integration
- Support → Manufacturer integration expertise
🎯 Strategic Tip:
Complex integration can double commissioning time. Budget 30-50% more time for projects requiring deep ERP/MES integration. Simple machine-to-machine connection typically adds 1-2 weeks to installation.
ROI Perspective:
Well-integrated systems deliver:
- 📊 15-25% improvement in OEE (real-time visibility)
- ⏱️ 30-40% reduction in reporting time (automated)
- 🔍 100% traceability (compliance + quality)
- 💰 Payback period: 12-18 months
🔮 Future Outlook: Technology Trends Shaping 2026
Five Game-Changing Trends
Trend 1: Artificial Intelligence & Predictive Maintenance 🤖
AI Transforming Blister Packaging Operations
Core AI Applications:
| Function | AI Technology | Impact | Adoption Rate |
|---|---|---|---|
| Predictive maintenance | Machine learning | 40% downtime ↓ | 65% |
| Quality inspection | Computer vision | 30% defect ↓ | 70% |
| Process optimization | Neural networks | 15% efficiency ↑ | 45% |
| Digital twins | Simulation AI | Risk-free testing | 30% |
🔬 How AI Works in Blister Machines
Predictive Maintenance Workflow:
- 📊 Data Collection
- Vibration sensors
- Temperature monitoring
- Pressure tracking
- Motor current analysis
- 🧠 AI Analysis
- Pattern recognition
- Anomaly detection
- Trend prediction
- Failure forecasting
- ⚠️ Predictive Alerts
- 7-14 days advance warning
- Component-specific diagnosis
- Failure probability score
- Recommended actions
- 🔧 Preventive Action
- Scheduled maintenance
- Parts ordering automation
- Downtime minimization
- Cost optimization
📊 AI Impact Metrics
Before AI vs. After AI:
| Metric | Traditional | AI-Enabled | Improvement |
|---|---|---|---|
| Unplanned Downtime | 12-15% | 7-9% | -40% |
| First-Pass Quality | 96-97% | 98.5-99% | +2-3% |
| Maintenance Costs | Baseline | -25% | Significant |
| Equipment Life | 12-15 years | 15-20 years | +20-30% |
🎯 Self-Optimizing Systems
Autonomous Quality Adjustment:
Real-Time Optimization:
- 🌡️ Temperature control → Self-adjusting
- 💪 Sealing pressure → Dynamic optimization
- ⚡ Speed regulation → Quality-driven
- 📏 Film tension → Automatic correction
Learning Capabilities:
- 📚 Process memory
- 🔄 Continuous improvement
- 🎯 Best practice adoption
- 📊 Historical pattern analysis
🏆 AI Leaders in 2026
Manufacturer AI Implementations:
| Manufacturer | AI Feature | Maturity |
|---|---|---|
| Uhlmann | SmartControl + predictive analytics | Advanced |
| IMA | C.O.M.E.T. Technology | Advanced |
| ACG | Smart Connected Machines | Intermediate |
| Syntegon | Digital twin simulation | Advanced |
📅 2026 AI Expectations
Standard Features by 2026:
- ✅ Predictive maintenance (70% adoption)
- ✅ Self-learning quality systems (50% adoption)
- ✅ Autonomous parameter optimization (40% adoption)
- ✅ Digital twin integration (35% adoption)
- ✅ AI-powered troubleshooting (60% adoption)
💰 Business Impact
ROI of AI Integration:
Investment: +$50K-$150K premium
Returns:
- 💰 Maintenance cost reduction: $30K-$80K/year
- ⏱️ Downtime reduction value: $50K-$150K/year
- 📈 Quality improvement value: $20K-$60K/year
- Payback Period: 6-18 months
💡 Strategic Insight:
AI is transitioning from competitive advantage to baseline requirement. By 2026, machines without AI capabilities will be considered obsolete in high-value pharmaceutical applications.
Trend 2: Sustainable & Recyclable Packaging Materials ♻️
The Green Revolution in Blister Packaging
Material Evolution Timeline:
| Era | Dominant Material | Recyclability | Current Status |
|---|---|---|---|
| 2015-2020 | PVC | ⭐ (5%) | Legacy |
| 2020-2024 | PET/PP | ⭐⭐⭐ (60%) | Transitional |
| 2024-2026 | Paper-based | ⭐⭐⭐⭐⭐ (95%) | Emerging |
| 2026+ | Bio-based films | ⭐⭐⭐⭐⭐ (100%) | Future |
🌿 Sustainable Material Options
Material Comparison Matrix:
| Material | Barrier | Cost | Recyclability | Machine Compatibility |
|---|---|---|---|---|
| PVC | High | $ | Low (5%) | Universal |
| PET | Medium | $$ | Good (60%) | Most machines |
| Paper blister | Medium | $$$ | Excellent (95%) | Specialized |
| PLA/PBS | Medium | $$$$ | Full (100%) | Limited |
📦 Paper-Based Blister Technology
Innovation Breakthrough:
Thermoformable Paperboard:
- 🌾 100% fiber-based
- ♻️ Fully recyclable in paper stream
- 🔒 Maintains product protection
- 🏆 Consumer preference leader
Performance Characteristics:
| Metric | Paper-Based | Traditional PVC |
|---|---|---|
| Moisture barrier | Good (with coating) | Excellent |
| Oxygen barrier | Moderate | Good |
| Recyclability | 95%+ | <5% |
| Consumer preference | 78% prefer | 22% prefer |
| Carbon footprint | -60% vs PVC | Baseline |
🏆 Sustainability Innovation Leaders
Pioneering Programs:
Syntegon – SBP Initiative:
- 🎯 Goal: 100% recyclable by 2025
- 💰 Investment: €50M in R&D
- 🏆 Award: German Sustainability Award
- 📊 Impact: 40% material reduction
IMA – Eco-Design Line:
- ♻️ Mono-material solutions
- 🌱 Bio-based film compatibility
- ⚡ 30% energy reduction
- 🏅 WorldStar Packaging Award
Marchesini – Green Blister:
- 📄 Paper-hybrid systems
- 🔄 Material circularity focus
- 🌍 EU PPWR compliant
- 💚 Carbon-neutral operations
📜 Regulatory Drivers
EU Packaging & Packaging Waste Regulation (PPWR):
2030 Targets:
| Requirement | Target | Current | Gap |
|---|---|---|---|
| Recyclability | 65% minimum | 35% | -30% |
| Recycled content | 25% minimum | 10% | -15% |
| Reusability | 10% pharma | 2% | -8% |
Extended Producer Responsibility:
- 💰 Packaging waste fees
- 📊 Mandatory reporting
- ♻️ Collection system funding
- 🎯 Design for recycling
🌱 Bio-Based Film Development
Next-Generation Materials:
PLA (Polylactic Acid):
- 🌽 Corn-based polymer
- 🔄 Industrially compostable
- 📊 Status: Clinical trials
- 🎯 Availability: 2026-2027
PBS (Polybutylene Succinate):
- 🌾 Bio-based synthesis
- ♻️ Biodegradable
- 📊 Status: Limited production
- 🎯 Availability: 2027-2028
Seaweed-Based Films:
- 🌊 Marine biomass
- 🔄 Home compostable
- 📊 Status: R&D phase
- 🎯 Availability: 2028+
📊 Market Adoption Projections
2026 Material Mix Forecast:
| Material Category | 2024 | 2026 | 2030 (projected) |
|---|---|---|---|
| PVC | 55% | 35% | 15% |
| PET/PP | 35% | 45% | 35% |
| Paper-based | 8% | 15% | 30% |
| Bio-based | 2% | 5% | 20% |
💰 Economic Impact
Cost Comparison (per 1000 blisters):
| Material | Raw Material | Processing | Total | vs PVC |
|---|---|---|---|---|
| PVC | $12 | $8 | $20 | Baseline |
| PET | $15 | $9 | $24 | +20% |
| Paper | $22 | $12 | $34 | +70% |
| Bio-based | $28 | $14 | $42 | +110% |
Price Trend: Sustainable materials decreasing 10-15% annually as volume scales.
🏭 Machine Adaptation Requirements
Conversion Considerations:
Minor Modifications ($10K-$30K):
- ✅ PVC → PET/PP
- ✅ Temperature adjustments
- ✅ Tooling changes
Major Modifications ($50K-$150K):
- 🔧 PVC → Paper-based
- 🔧 Forming system upgrade
- 🔧 Sealing mechanism change
New Equipment Required:
- 🆕 Bio-based films (limited machines)
- 🆕 Specialized forming technology
- 🆕 Novel sealing methods
🎯 Strategic Recommendations
For Manufacturers:
- 2024-2025: Ensure PET/PP compatibility
- 2025-2026: Evaluate paper-based systems
- 2026-2027: Pilot bio-based materials
- 2027+: Phase out PVC completely
Investment Priority:
- ✅ High: PET/PP capability (immediate ROI)
- ✅ Medium: Paper-based readiness (2-3 year horizon)
- ⏳ Low: Bio-based (watch and wait)
💡 Future-Proofing Advice:
Purchase machines with material flexibility built-in. The premium for multi-material capability ($30K-$80K) is cheaper than equipment replacement ($200K-$500K) in 3-5 years.
Brand Pressure Factor:
Major pharmaceutical companies (Pfizer, Novartis, GSK) have committed to 100% recyclable packaging by 2025-2030. Suppliers must adapt or risk losing business.
Trend 3: Smart Blister Packaging with Connected Features 📱
From Passive to Interactive Packaging
The Digital Transformation:
Traditional Blister (2020):
- 📦 Product containment
- 🔒 Protection only
- 👁️ Visual identification
Smart Blister (2026):
- 📦 + 📱 Digital connectivity
- 🔒 + 🔐 Authentication
- 👁️ + 📊 Data generation
- 💊 + ⚕️ Patient engagement
📱 Smart Packaging Technologies
Integration Technology Matrix:
| Technology | Function | Cost per Unit | Maturity |
|---|---|---|---|
| NFC Chips | Smartphone interaction | $0.10-$0.30 | Mature |
| QR Codes | Information access | $0.01-$0.03 | Mature |
| RFID Tags | Supply chain tracking | $0.05-$0.15 | Mature |
| Printed Electronics | Sensing capability | $0.20-$0.50 | Emerging |
| Bluetooth Tags | Real-time monitoring | $0.50-$1.00 | Early |
🏥 Healthcare Applications
Patient Adherence Monitoring:
Smart Blister Capabilities:
- 📅 Dose Tracking
- Automatic detection when blister opened
- Timestamp recording
- Cloud data sync
- Adherence calculation
- ⏰ Medication Reminders
- Smartphone notifications
- Customized schedules
- Caregiver alerts
- Missed dose warnings
- 📊 Data Analytics
- Adherence patterns
- Effectiveness correlation
- Behavioral insights
- Clinical trial data
- 👨⚕️ Healthcare Provider Connection
- Real-time patient monitoring
- Intervention triggering
- Outcomes tracking
- Telehealth integration
🔬 Clinical Applications
Smart Packaging for Trials:
| Feature | Benefit | Trial Phase |
|---|---|---|
| Automated compliance | Objective adherence data | Phase II-IV |
| Temperature monitoring | Cold chain verification | All phases |
| Tamper detection | Product integrity | All phases |
| Blind maintenance | Double-blind assurance | Phase III |
🔒 Supply Chain & Anti-Counterfeiting
Authentication Technologies:
Blockchain Integration:
- 🔗 Immutable product history
- ✅ Origin verification
- 🌍 Multi-party trust
- 🔍 Real-time authentication
Smart Features:
| Layer | Technology | Protection Level |
|---|---|---|
| Level 1 | QR code (overt) | Basic (consumer check) |
| Level 2 | Serialization + database | Advanced (pharmacy verify) |
| Level 3 | NFC + blockchain | Maximum (impossible to fake) |
📊 Market Adoption by Segment
2026 Smart Pack Penetration:
| Medication Category | Smart Pack % | Primary Driver |
|---|---|---|
| Chronic disease | 45-50% | Adherence monitoring |
| Specialty pharma | 60-70% | High value + outcomes |
| Biologics | 70-80% | Cold chain + compliance |
| Oncology | 55-65% | Safety + adherence |
| Generic drugs | 10-15% | Cost constraints |
💡 Patient Engagement Ecosystem
Smartphone App Features:
Core Functions:
- 📱 Medication reminder
- 📊 Adherence dashboard
- 📚 Educational content
- 💬 Chat with pharmacist
- 🔔 Refill reminders
- 🏥 Provider sharing
Advanced Features:
- 🤖 AI symptom checker
- 📈 Effectiveness tracking
- 🎮 Gamification rewards
- 👥 Community support
- 📹 Video consultations
🌡️ Environmental Monitoring
Smart Sensors in Blisters:
Temperature Indicators:
- ❄️ Freeze detection
- 🔥 Heat exposure alert
- 📊 Full temperature history
- ⚠️ Out-of-spec warnings
Humidity Sensors:
- 💧 Moisture ingress detection
- 📈 Trending over time
- 🚨 Threshold alerts
- 🔬 Stability correlation
🏭 Manufacturing Integration
Smart Packaging Line Requirements:
New Capabilities Needed:
| Component | Function | Investment |
|---|---|---|
| Chip insertion | NFC/RFID placement | $80K-$150K |
| Coding system | QR/barcode printing | $30K-$80K |
| Vision verification | Code readability | $40K-$100K |
| Database integration | Real-time sync | $20K-$60K |
💰 Economics of Smart Packaging
Cost-Benefit Analysis:
Per-Unit Cost Addition:
| Technology | Added Cost | Patient Value | Payer Willingness |
|---|---|---|---|
| Basic QR | $0.02 | Information access | Limited |
| NFC chip | $0.15 | Adherence tracking | Moderate |
| Full smart | $0.50 | Complete monitoring | High (chronic) |
ROI for High-Value Drugs:
Drug Cost >$100/month:
- 💊 10% adherence improvement
- 💰 $10/month better outcomes
- 🎯 $0.50 smart pack cost
- ROI: 20:1 (highly positive)
🚀 Future Capabilities (2027+)
Next-Generation Smart Features:
- 🧬 Personalized dosing based on genetics
- 🔬 Biomarker detection (saliva, sweat)
- 🤖 AI health coach integration
- 🏥 Automated prescription renewal
- 💳 Direct-to-consumer ordering
⚕️ Regulatory Considerations
FDA/EMA Guidance:
Classification:
- 📦 Packaging only: No extra approval
- 📱 With software: Medical device review
- 🩺 Diagnostic claims: Higher classification
Data Privacy:
- 🔒 HIPAA compliance (USA)
- 🇪🇺 GDPR compliance (Europe)
- 🔐 Cybersecurity standards
- 📋 Patient consent requirements
🎯 2026 Market Outlook
Smart Blister Market Size:
2024: $450M
2026: $1.2B (+167%)
2030: $4.8B (projected)
CAGR: 35%
Key Growth Drivers:
- 📱 Smartphone ubiquity
- 💰 Value-based care models
- 🧓 Aging population needs
- 🤖 AI/ML advancements
- 🌍 Global connectivity
💡 Strategic Insight:
Smart blister packaging represents the convergence of pharma, digital health, and consumer electronics. Companies investing in smart packaging infrastructure now will lead the “connected health” revolution of the late 2020s.
Manufacturer Readiness:
Only ~25% of current blister machines can accommodate smart features without major modifications. This creates a significant equipment refresh opportunity for forward-thinking companies.
Trend 4: Modular & Flexible Production Lines 🔧
The Age of Manufacturing Agility
Market Forces Driving Flexibility:
| Trend | Impact | Required Response |
|---|---|---|
| Personalized medicine | Batch sizes ↓ 80% | Ultra-flexible lines |
| Orphan drugs | SKU variety ↑ 300% | Quick changeovers |
| Clinical acceleration | Lead times ↓ 50% | Scalable systems |
| Regional variations | Package formats ↑ 200% | Multi-format capability |
⚡ Changeover Time Evolution
The Speed Revolution:
| Era | Changeover Time | Technology | Productivity |
|---|---|---|---|
| 2015 | 2-4 hours | Manual tooling | 60-70% uptime |
| 2020 | 30-60 minutes | Quick-change | 75-85% uptime |
| 2024 | 15-30 minutes | Semi-automated | 85-92% uptime |
| 2026 | 5-15 minutes | AI-assisted | 92-97% uptime |
🔧 Tool-Free Changeover Technology
Next-Gen Quick-Change Systems:
Key Innovations:
- 📏 Pre-Calibrated Modules
- Plug-and-play design
- No manual adjustment
- Self-centering mechanisms
- Automatic recognition
- 🤖 Robotic Tool Handling
- Automated format part exchange
- Tool storage carousel
- Zero-error placement
- Single-button operation
- 🧠 AI Recipe Management
- Automatic parameter loading
- Historical optimization
- Predictive adjustments
- Quality verification
🎯 Multi-Format Capability
Single Line Versatility:
Product Range Handled:
| Category | Range | Package Options |
|---|---|---|
| Tablets | 3mm – 25mm ø | 1-10 cavities |
| Capsules | Size 5 – 0000 | Horizontal/vertical |
| Shapes | Round, oval, oblong, custom | Any geometry |
| Materials | PVC, PET, paper, Alu-Alu | All types |
Package Format Flexibility:
- 📦 Unit dose (single cavity)
- 📦 Multi-cavity (2-10 units)
- 📦 Calendar packs (28-30 units)
- 📦 Multi-product (different drugs)
- 📦 Variable count (dynamic cavity number)
🏗️ Modular Machine Architecture
Building Block Approach:
Core Modules:
| Module | Function | Interchangeability |
|---|---|---|
| Forming station | Blister creation | 100% (tooling) |
| Feeding system | Product loading | 80% (hopper) |
| Sealing unit | Packaging closure | 60% (heat/cold) |
| Inspection | Quality verification | 90% (cameras) |
| Serialization | Track & trace | 100% (printer) |
Upgrade Path:
Basic Line (Year 1)
    ↓ +Vision System (Year 2)
    ↓ +Serialization (Year 3)
    ↓ +AI Optimization (Year 4)
    ↓ +Smart Packaging (Year 5)
📈 Economic Batch Size Revolution
2026 Commercially Viable Batch Sizes:
| Application | Minimum Batch | Setup Cost | Unit Cost |
|---|---|---|---|
| Clinical trials | 500 units | $150 | $0.30 |
| Orphan drugs | 5,000 units | $400 | $0.08 |
| Specialty pharma | 20,000 units | $800 | $0.04 |
| Commercial generics | 100,000+ units | $1,200 | $0.012 |
Flexibility ROI Example:
Scenario: 50 different SKUs, 10,000 units each
Traditional Line (60 min changeover):
- ⏱️ Total changeover: 50 hours/year
- 💰 Downtime cost: $75,000
- 🏭 Requires: 2-3 dedicated lines
- Total investment: $800K-$1.2M
Flexible Line (15 min changeover):
- ⏱️ Total changeover: 12.5 hours/year
- 💰 Downtime cost: $18,750
- 🏭 Requires: 1 flexible line
- Total investment: $550K
Savings: $250K-$650K capital + $56K annual operating
🎨 Format Part Innovation
Smart Tooling Features:
RFID-Enabled Format Parts:
- 🏷️ Automatic identification
- 📊 Usage tracking
- 🔧 Maintenance alerts
- 📚 Recipe auto-loading
3D-Printed Custom Tooling:
- ⚡ 48-hour lead time (vs 4-6 weeks)
- 💰 70% cost reduction
- 🎯 Perfect customization
- 🔄 Rapid iteration
🤖 Servo Technology Advantages
Precision & Flexibility:
vs. Mechanical Cam Systems:
| Metric | Servo-Driven | Mechanical | Advantage |
|---|---|---|---|
| Changeover time | 5-15 min | 60-120 min | 8-12× faster |
| Flexibility | Infinite adjustment | Fixed cams | Unlimited |
| Precision | ±0.05mm | ±0.2mm | 4× better |
| Energy use | -30% | Baseline | Significant savings |
📊 Flexible Line Market Growth
Market Projections:
Flexible Blister Lines Market:

2024: $850M
2026: $1.4B (+65%)
2030: $2.8B (projected)

% of Total Market:
2024: 24%
2026: 38%
2030: 55% (majority)
🎯 Flexibility Features Checklist
When Evaluating Machines:
Must-Have (2026):
- <30 minute changeover time
- Multi-format capability (3+ sizes)
- Tool-free format change
- Recipe management system
- Servo-driven operations
Nice-to-Have:
- <15 minute changeover
- RFID tooling identification
- Robotic tool handling
- AI-assisted optimization
- Modular upgrade path
Future-Proof:
- Multi-material capability
- Smart packaging ready
- Digital twin integration
- 5-year technology roadmap
💡 Strategic Recommendations
For Different Business Sizes:
Large Pharma (>$1B revenue):
- ✅ Invest in both dedicated + flexible lines
- ✅ Use flexible for innovation/specialty
- ✅ Dedicated for high-volume generics
Mid-Size ($100M-$1B):
- ✅ Prioritize flexible platforms
- ✅ Single line, multiple products
- ✅ Maximize asset utilization
Small/Emerging (<$100M):
- ✅ Flexible-only strategy
- ✅ Start modular, upgrade over time
- ✅ Lease/finance to conserve capital
CDMOs:
- ✅ Maximum flexibility essential
- ✅ Quick changeover = competitive advantage
- ✅ Multi-client capability
- ✅ Wide format part library
🚀 Future Vision:
By 2030, expect “universal blister lines” capable of handling any format with <5 minute changeovers through AI-guided robotic tooling exchange. The line of tomorrow will be a software-defined platform where physical limitations nearly disappear.
Trend 5: Advanced Serialization & Track-and-Trace Integration 🔗
Global Regulatory Expansion
Serialization Map 2026:
| Region | Status | Deadline | Enforcement |
|---|---|---|---|
| 🇺🇸 USA (DSCSA) | Enforced | Nov 2023 | Active penalties |
| 🇪🇺 EU (FMD) | Enforced | Feb 2019 | Mature system |
| 🇨🇳 China (NMPA) | Phase 3 | 2026 | Rolling implementation |
| 🇮🇳 India | Phased | 2025-2027 | Pilot programs |
| 🌍 MENA | Growing | Varies | Country-specific |
| 🇧🇷 Brazil | Mandatory | 2022 | Established |
🔐 Serialization Hierarchy
Five-Level System:
Level 5: Shipment/Container
    ↓ (Aggregation)
Level 4: Pallet
    ↓ (Aggregation)
Level 3: Case/Shipper
    ↓ (Aggregation)
Level 2: Carton/Bundle
    ↓ (Aggregation)
Level 1: Individual Blister Pack (Unit Level)
📊 Unit-Level Serialization
Unique Identifier Components:
Barcode Content (GS1 Standard):
| Data Element | Purpose | Example |
|---|---|---|
| GTIN | Product identifier | (01)00312345678906 |
| Serial Number | Unique unit ID | (21)1234567890 |
| Lot/Batch | Manufacturing batch | (10)ABC123 |
| Expiry Date | Shelf life | (17)250630 |
Code Types:
- 📊 DataMatrix (2D barcode) – Most common
- 📊 QR Code (alternative 2D)
- 📊 Linear barcode (legacy systems)
🖨️ Printing Technologies
On-Pack Coding Methods:
| Technology | Speed | Quality | Cost/Unit | Pharma Grade |
|---|---|---|---|---|
| Thermal Inkjet | High | Excellent | $0.005 | ✅ Yes |
| Laser Marking | Medium | Superior | $0.008 | ✅ Yes |
| Thermal Transfer | Medium | Good | $0.012 | ✅ Yes |
| Continuous Inkjet | Very high | Fair | $0.003 | ⚠️ Limited |
🔍 Vision Verification
100% Code Readability Check:
Inspection Parameters:
| Check | Standard | Reject Threshold |
|---|---|---|
| Contrast | ISO 15415 | Grade C or better |
| Decodability | GS1 spec | 100% readable |
| Position | Tolerance ±2mm | Outside zone = reject |
| Damage | Visual inspection | Any damage = reject |
Verification Speed:
- ⚡ 300-600 codes/minute
- 🎯 99.99% accuracy
- 📊 Full audit trail
- 🔔 Real-time alerts
🌐 Level 3/4 System Integration
Serialization Ecosystem Architecture:
Data Flow:
Blister Machine (Level 1)
    ↓ Serial numbers
Line Controller (Level 2)
    ↓ Aggregation + events
Site Serialization Server (Level 3)
    ↓ Repository + reporting
Enterprise System / Cloud (Level 4)
    ↓ Global visibility
Regulatory Authorities (Level 5)
    ↑ Verification requests
🔗 Blockchain Integration
Next-Gen Authentication:
Traditional vs. Blockchain:
| Aspect | Traditional | Blockchain | Advantage |
|---|---|---|---|
| Data storage | Centralized DB | Distributed ledger | Tamper-proof |
| Trust model | Single authority | Multi-party consensus | Transparent |
| Auditability | Limited history | Complete provenance | Full traceability |
| Security | Hackable | Cryptographically secured | Fraud-resistant |
Pharma Blockchain Use Cases:
- 🔒 Anti-Counterfeiting
- Immutable product history
- Multi-party verification
- Consumer authentication
- Grey market prevention
- 📦 Supply Chain Transparency
- Real-time tracking
- Temperature monitoring
- Custody chain
- Recall management
- 🏥 Patient Safety
- Authentic medication verification
- Adverse event correlation
- Clinical trial integrity
- Outcomes tracking
🌡️ IoT Sensor Integration
Environmental Monitoring:
Cold Chain Tracking:
| Sensor Type | Data Captured | Frequency | Alert Threshold |
|---|---|---|---|
| Temperature | °C/°F | Every 5 min | >25°C or <2°C |
| Humidity | %RH | Every 15 min | >60% RH |
| Shock | G-force | Event-based | >5G impact |
| Location | GPS coordinates | Every hour | Geofence violation |
Data Integration:
- 📊 Blockchain-stored sensor data
- ⚠️ Automated quality alerts
- 📋 Regulatory compliance documentation
- 🔍 Root cause analysis capability
🛠️ Augmented Reality (AR) for Maintenance
Technician Support Tools:
AR Glasses Applications:
- 🔧 Guided Maintenance
- Step-by-step visual overlays
- Part identification assistance
- Torque specification display
- Safety warnings
- 📊 Real-Time Diagnostics
- Sensor data visualization
- Error code explanation
- Troubleshooting flowcharts
- Expert remote guidance
- 🎓 Training Enhancement
- Interactive learning modules
- Hands-free documentation access
- Skill assessment
- Certification tracking
Performance Impact:
| Metric | Without AR | With AR | Improvement |
|---|---|---|---|
| Repair time | 4.5 hours | 2.0 hours | -56% |
| Error rate | 8% | 2% | -75% |
| Training time | 40 hours | 24 hours | -40% |
| Expert dependency | High | Low | Significant |
📊 Aggregation Automation
Intelligent Packaging Hierarchy:
Automated Case Packing:
- 🤖 Robotic pick-and-place → Blister to carton
- 📷 Vision-guided → Carton to case
- 🏷️ RFID tracking → Case to pallet
- 📊 Real-time aggregation → Database updates
Benefits:
- ✅ Zero aggregation errors
- ✅ 100% traceability
- ✅ Labor reduction (70%)
- ✅ Faster throughput (40%)
🌍 Global Traceability Platform
End-to-End Visibility:
Stakeholder Access:
| User | View Level | Capabilities |
|---|---|---|
| Manufacturer | Full history | Production + distribution |
| Distributor | Supply chain | Shipment tracking |
| Pharmacy | Verification | Authenticity check |
| Regulator | Compliance | Audit + investigation |
| Patient | Product info | Verification + education |
💰 Cost of Serialization
Investment Requirements:
Initial Setup:
| Component | Cost Range | Notes |
|---|---|---|
| Line equipment | $150K-$300K | Printers + vision + controls |
| Level 3 software | $100K-$250K | Site server + licenses |
| Level 4 integration | $200K-$500K | Enterprise connectivity |
| Validation | $50K-$150K | IQ/OQ/PQ documentation |
| Training | $20K-$50K | Personnel certification |
Ongoing Costs:
- 📄 Per-unit code cost: $0.005-$0.015
- 🔧 Maintenance: $30K-$60K/year
- 💾 Data storage: $10K-$30K/year
- 🔄 Software updates: $15K-$40K/year
📅 2026 Serialization Landscape
Standard Features Expected:
🚨 Recall Management Enhancement
Precision Recall Capability:
Traditional Recall:
- 📦 Entire batch/lot recalled
- 🏪 Pharmacy-level tracking only
- ⏱️ Weeks to identify affected units
- 💰 Millions in waste
Serialized Recall:
- 🎯 Unit-level precision
- 🌍 Global real-time identification
- ⏱️ Hours to locate all affected
- 💰 90% waste reduction
🎯 Compliance Strategy
Phased Implementation Roadmap:
Phase 1 (Essential):
- Unit-level serialization
- Vision verification (100%)
- Level 3 server deployment
- Basic aggregation
Phase 2 (Advanced):
- Multi-site integration
- Predictive analytics
- Advanced aggregation
- Partner connectivity
Phase 3 (Future-Ready):
- Blockchain integration
- IoT sensor fusion
- AI-powered analytics
- Patient-facing features
💡 Compliance Imperative:
Non-compliance with serialization regulations = market access denial in USA, EU, China, and growing list of countries. This is not optional—it’s a prerequisite for doing business.
Strategic Insight:
Serialization is evolving from regulatory burden to strategic asset. Companies leveraging track-and-trace data for supply chain optimization, quality improvements, and patient engagement will gain significant competitive advantages beyond mere compliance.
🎯 Conclusion & Action Plan
Key Takeaways Summary
🏆 The 2026 Blister Packaging Landscape
Four Defining Pillars:
1. Market Leadership (70%+ Control)
| Region | Top Manufacturers | Strength |
|---|---|---|
| 🇩🇪 Germany | Uhlmann, Romaco, Syntegon | Precision + Industry 4.0 |
| 🇮🇹 Italy | IMA, Marchesini, CAM | Flexibility + design |
| 🇮🇳 India/Asia | ACG, Jornen | Integration + value |
| 🇺🇸 USA | SED, PharmaWorks | Customization + support |
2. Technology Sophistication (Essential 2026)
- 🤖 AI predictive maintenance → 40% downtime reduction
- ♻️ Sustainable materials → Regulatory compliance
- 📱 Smart packaging → Patient engagement
- 🔧 Flexible systems → Agile manufacturing
- 🔗 Serialization → Global market access
3. Sustainability Mandates (Non-Negotiable)
- 📊 EU PPWR targets: 65% recyclability by 2030
- 🌱 Paper-based adoption: 15% in 2026 → 30% by 2030
- ⚡ Energy efficiency: Standard requirement
- 🔄 Circular economy: Business imperative
4. Quality & Compliance (Baseline Expectation)
- 🔗 Serialization: 80%+ global coverage
- 📋 21 CFR Part 11: Standard feature
- 🔍 100% vision inspection: High-value norm
- 📊 Real-time data: Industry 4.0 requirement
🎯 Manufacturer Selection Matrix
Choose Based on Your Priority:
For Advanced Automation & Industry 4.0
Top 3 Recommendations:
- 🥇 Uhlmann → SmartControl + AI predictive
- 🥈 IMA → C.O.M.E.T. Technology
- 🥉 Syntegon → Digital twin + sustainability
For Best Value & Integration
Top 3 Recommendations:
- 🥇 ACG Worldwide → End-to-end solutions
- 🥈 Jornen → Cost-effective quality
- 🥉 SED Pharma → Americas value leader
For High-Speed Production
Top 3 Recommendations:
- 🥇 Romaco → Unity 600 speed leader
- 🥈 IMA → Ultra-high output
- 🥉 Marchesini → Fast + modular
For Sustainability Focus
Top 3 Recommendations:
- 🥇 Syntegon → SBP Initiative pioneer
- 🥈 Marchesini → Eco-design innovation
- 🥉 IMA → Recyclable solutions
For Clinical/R&D Applications
Top 3 Recommendations:
- 🥇 PharmaWorks → Clinical specialist
- 🥈 SED Pharma → Flexible + compact
- 🥉 CAM → Custom solutions
For Custom Requirements
Top 3 Recommendations:
- 🥇 CAM → Precision engineering
- 🥈 PharmaWorks → Tooling innovation
- 🥉 Marchesini → Modular customization
📊 Investment Decision Framework
Strategic Perspective
This is Infrastructure Investment:
| Impact Area | Duration | Business Effect |
|---|---|---|
| Operational | 10-15 years | Daily production capacity |
| Financial | 5-year TCO | Cost structure |
| Regulatory | Ongoing | Market access |
| Competitive | Strategic | Market positioning |
| Innovation | Technology life | Product flexibility |
Not Just Equipment:
🚀 Your Action Plan
Phase 1: Preparation (Weeks 1-2)
Step 1: Form Cross-Functional Team
Essential Members:
| Role | Responsibility | Time Commitment |
|---|---|---|
| Production Manager | Capacity planning | 40% |
| Quality Director | Compliance requirements | 30% |
| Engineering Lead | Technical evaluation | 50% |
| Regulatory Affairs | Compliance verification | 20% |
| Finance/Procurement | Budget + contracting | 30% |
| IT/Automation | Integration planning | 20% |
Step 2: Define Requirements
Create Requirement Document:
- Production specs (volume, products, growth)
- Technical requirements (materials, formats, speeds)
- Compliance needs (regulations, validation)
- Budget constraints (capital + TCO)
- Timeline (urgency, installation window)
- Strategic goals (sustainability, flexibility, automation)
Step 3: Conduct Internal Assessment
Evaluate:
- Current equipment limitations
- Facility constraints (space, utilities)
- Operator skill levels
- Integration requirements
- Risk tolerance
Phase 2: Market Research (Weeks 3-6)
Step 4: Initial Manufacturer Contact
Shortlist 5-7 Manufacturers:
Based on your priority matrix (see above)
Request:
- Technical specifications
- Product brochures
- Customer case studies
- Preliminary pricing
- Reference list
Step 5: Virtual Presentations
Schedule 60-90 Min Sessions:
Agenda:
- Technology overview (20 min)
- Your application discussion (20 min)
- Q&A (20 min)
- Demonstration video (20 min)
Evaluation Criteria:
| Factor | Weight | Scoring Method |
|---|---|---|
| Technical fit | 30% | Requirements match |
| Company stability | 15% | Financial + reputation |
| Support capability | 20% | Service network |
| Cost | 20% | TCO analysis |
| Innovation | 15% | Future-readiness |
Step 6: Reference Checks
Contact 3-5 References per Manufacturer:
Key Questions:
- “What’s your actual uptime percentage?”
- “How responsive is their service?”
- “Any hidden costs after purchase?”
- “Would you buy from them again?”
- “What do you wish you knew before buying?”
Phase 3: Evaluation (Weeks 7-12)
Step 7: Site Visits to Reference Installations
Visit 2-3 Operational Sites:
Observe:
- Actual operation (not demo)
- Changeover process (time it)
- Maintenance procedures
- Operator feedback
- Real production environment
Ask Operators:
- “What’s easy about this machine?”
- “What’s frustrating?”
- “How often does it break down?”
- “Is training adequate?”
Step 8: Equipment Demonstrations
Factory Acceptance Test (FAT) Planning:
Bring Your Actual:
- ✅ Products (tablets/capsules)
- ✅ Packaging materials
- ✅ Quality requirements
- ✅ Production team members
Test:
- Format changeover (time precisely)
- Multiple products
- Quality verification
- Integration capabilities
- Ease of operation
Step 9: Technical Deep Dive
Engineering Review:
- Mechanical design assessment
- Electrical specifications verification
- Software capabilities evaluation
- Integration protocol review
- Maintenance requirements analysis
Phase 4: Decision (Weeks 13-16)
Step 10: Comprehensive Evaluation
Create Scoring Matrix:
Example Weights:
| Category | Weight | Manufacturer A | Manufacturer B | Manufacturer C |
|---|---|---|---|---|
| Technical fit | 30% | 85/100 | 90/100 | 75/100 |
| TCO (5-year) | 20% | 78/100 | 82/100 | 88/100 |
| Support | 20% | 90/100 | 75/100 | 70/100 |
| Innovation | 15% | 88/100 | 92/100 | 65/100 |
| Company stability | 15% | 95/100 | 85/100 | 80/100 |
| TOTAL | 100% | 86.1 | 85.4 | 76.1 |
Step 11: Total Cost of Ownership Analysis
Request Detailed Breakdown:
- Purchase price (itemized)
- Installation costs
- Validation support
- Training (hours + cost)
- Year 1-5 maintenance estimates
- Energy consumption projections
- Consumables costs
- Spare parts pricing
Build 5-Year Model (see Step 7 of Buying Guide)
Step 12: Commercial Negotiation
Negotiable Items:
Price Components:
- 💰 Base machine price (10-15% flex)
- 🔧 Installation services (negotiable)
- 📚 Training hours (increase quantity)
- 📦 Spare parts package (bundled discount)
- 🛠️ Service contract (multi-year discount)
Non-Price Terms:
- ⏱️ Payment terms (progress payments vs. lump sum)
- 🏆 Performance guarantees (uptime, speed, quality)
- 📋 Validation support (IQ/OQ/PQ included)
- 🔄 Upgrade options (future technology)
- 🚚 Installation timeline (penalties for delays)
Phase 5: Implementation (Months 5-12)
Step 13: Contract & Project Planning
Finalize Agreement:
- Detailed technical specifications
- Acceptance criteria (FAT + SAT)
- Payment schedule
- Delivery timeline
- Installation plan
- Training schedule
- Warranty terms
- Service level agreement
Step 14: Installation & Qualification
Project Phases:
| Phase | Duration | Key Activities |
|---|---|---|
| Site preparation | 4-6 weeks | Utilities, layout, cleaning |
| Equipment delivery | 1 week | Rigging, positioning |
| Installation | 2-3 weeks | Mechanical, electrical, integration |
| IQ (Installation) | 1 week | Documentation verification |
| OQ (Operational) | 2-3 weeks | Functional testing |
| PQ (Performance) | 2-4 weeks | Production runs |
Step 15: Training & Optimization
Training Program:
Operators (5 days):
- Basic operation
- Standard changeovers
- Routine cleaning
- Basic troubleshooting
Maintenance (7 days):
- Preventive maintenance
- Part replacement
- Calibration
- Advanced troubleshooting
Engineers (5 days):
- System architecture
- Recipe management
- Integration
- Performance optimization
Step 16: Continuous Improvement
First 90 Days:
- 📊 Daily OEE tracking
- 🔧 Optimization cycles
- 🎓 Additional training as needed
- 📈 Performance benchmarking
- 🤝 Regular manufacturer check-ins
💡 Final Pro Tips for Success
✅ Do’s
1. Take Your Time
- Thorough evaluation saves years of problems
- Rush decisions = costly mistakes
- 6-month evaluation period is normal
2. Think Total Value, Not Price
- Lowest price ≠ best value
- Focus on 5-year TCO
- Consider support quality
3. Test with Real Products
- Lab samples can be misleading
- Use actual production materials
- Simulate real conditions
4. Build Strong Relationships
- Manufacturer = long-term partner
- Chemistry matters
- Communication is key
5. Plan for Future
- Choose systems that grow with you
- Technology upgrade path
- Scalability matters
6. Involve End Users
- Operators provide critical insights
- Maintenance team input essential
- Buy-in = successful implementation
❌ Don’ts
1. Don’t Rush
- Major investment deserves time
- Pressure tactics = red flag
- “Limited time offer” = negotiate harder
2. Don’t Ignore Red Flags
- Poor customer references
- Unresponsive pre-sale = worse post-sale
- Vague technical answers
3. Don’t Overlook Support
- Great machine + poor support = disaster
- Local service is crucial
- Response time matters
4. Don’t Forget Integration
- Standalone machine rarely enough
- Plan upstream/downstream
- IT involvement essential
5. Don’t Skip References
- Sales presentations ≠ reality
- Talk to actual users
- Visit operating sites
6. Don’t Neglect Training
- Equipment is only as good as operators
- Invest in comprehensive training
- Budget ongoing education
📞 When to Seek Expert Help
Consider Independent Consultants If:
Consultant Value:
| Service | Benefit | Cost |
|---|---|---|
| Requirements definition | Clear specifications | $5K-$15K |
| Market research | Unbiased options | $10K-$25K |
| Technical evaluation | Independent assessment | $15K-$40K |
| Negotiation support | Better terms | $5K-$15K |
| Project management | Successful implementation | $30K-$80K |
ROI: Typically save 10-20× consultant fees through:
- Better equipment selection
- Improved negotiation
- Avoiding costly mistakes
- Faster implementation
🌟 Your Competitive Advantage
Making the Right Choice Today:
Positions You For:
- 🚀 Market leadership through operational excellence
- 💰 Cost advantage via efficiency gains
- 🏆 Quality leadership through advanced technology
- 🌍 Sustainability credentials and brand reputation
- 📈 Growth capability with flexible systems
- 🔮 Future readiness for emerging trends
The Next Decade Depends on Today’s Decision
Your blister packaging machine selection is not a procurement transaction—it’s a strategic infrastructure investment that will impact your:
- Daily operations for 10-15 years
- Competitive position
- Quality reputation
- Regulatory compliance
- Innovation capacity
- Market opportunities
Invest the time to get it right. Your future self will thank you.
📚 References & Resources
Industry Sources
- PharmaNow – Top Blister Packaging Machine Manufacturers
Comprehensive market share analysis and manufacturer profiles with detailed technology comparisons - Grand Pack Machine – Top 10 Blister Pack Manufacturers
Detailed comparison with ratings, specifications, and pros/cons analysis - Packaging Tech Today – Future of Pharma Blister Packaging
Technology trends, automation insights, and sustainability innovations - Pac Mastery – Comprehensive Guide to Blister Packing Machines
Practical buying guide with cost analysis and technical specifications - Strategic Packaging Insights – Market Report
Market research, growth projections through 2033, and industry forecasts